In this article
A container terminal is an easy place to see economic activity. Cranes move, vessels berth and traffic counts produce an apparently clear measure of progress. The harder question sits inside the businesses using that infrastructure: does the route allow them to make promises they can keep? This explanatory analysis examines the commercial mechanisms through which reliability can turn physical capacity into economic value. It is not an assessment of the returns on a specific project.
A count is a starting point
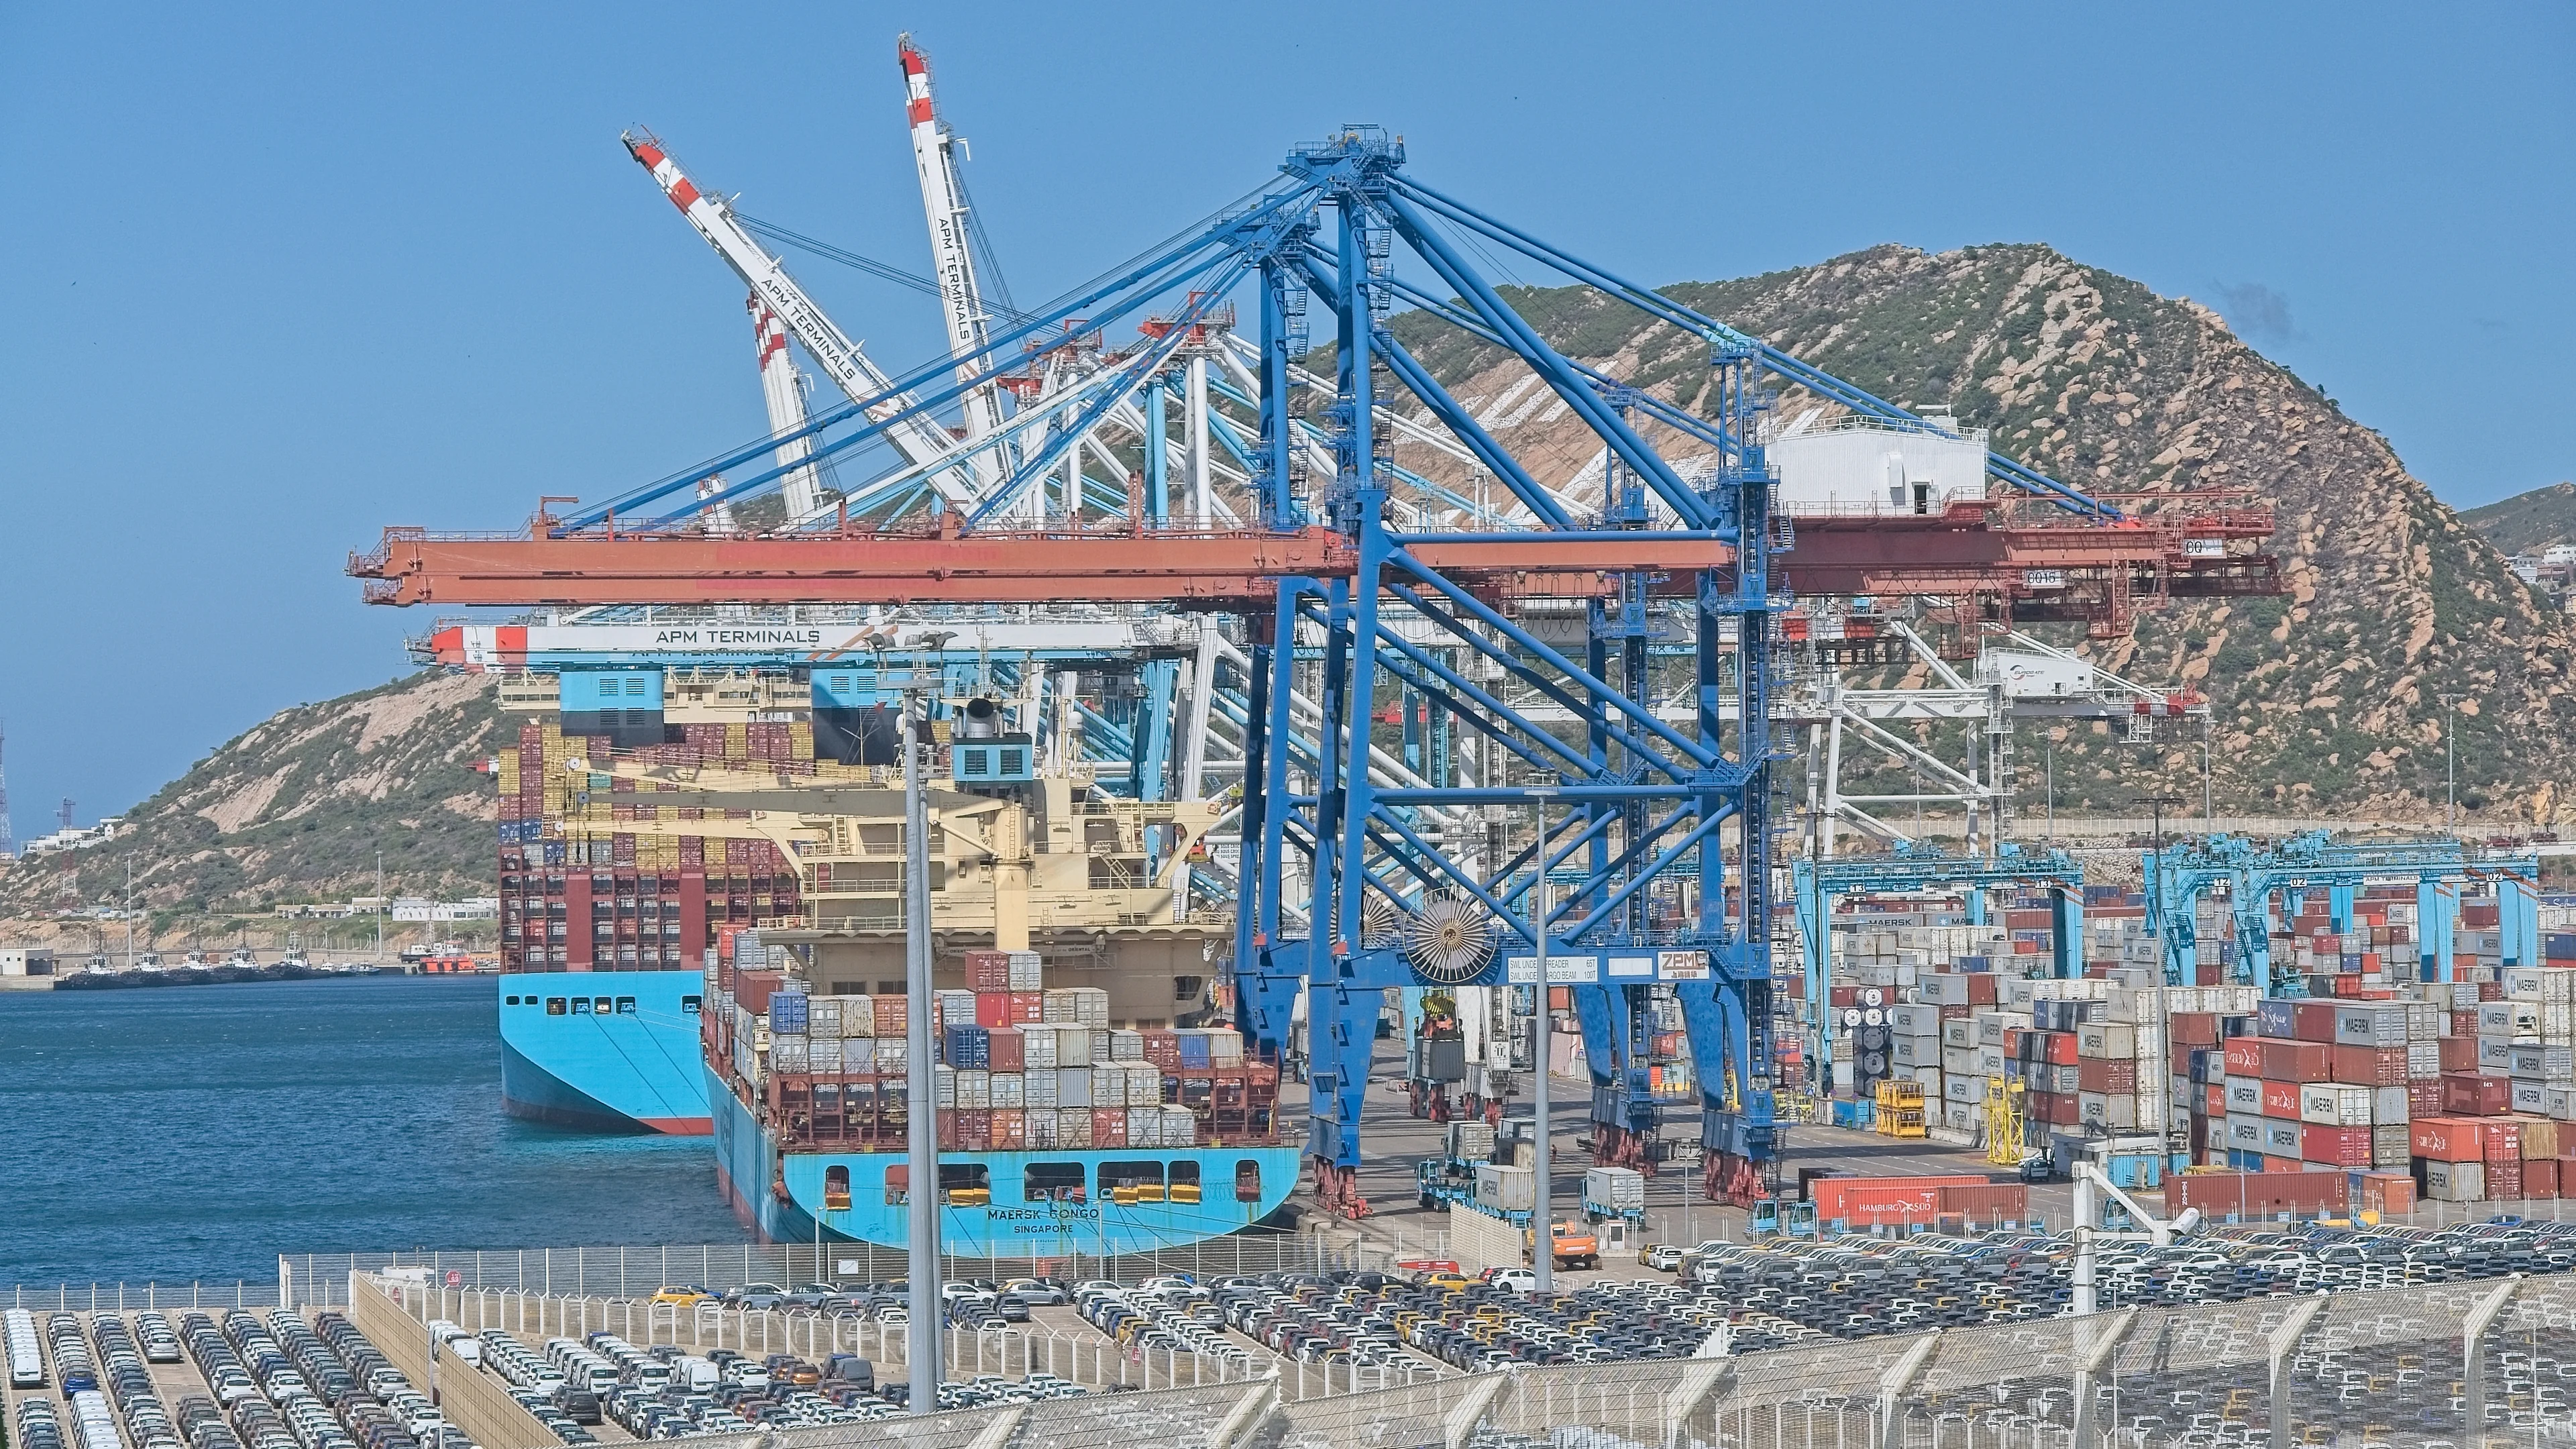
Tanger Med reported handling 11,106,164 twenty-foot equivalent units in 2025, up 8.4%. Its activity report also recorded rising truck traffic and falling vehicle volumes. Those measures describe different flows. They are valuable evidence of activity, but none alone establishes how much value local businesses retained, how productive a factory became or whether a particular investment earned an adequate return.
The distinction matters because infrastructure statistics and company economics answer different questions. A terminal can handle goods that are simply passing through. A manufacturer can increase output while importing a large share of its inputs. A logistics provider can gain revenue without improving its margin. Understanding development requires moving between these levels, rather than treating any one of them as the complete story.
The balance sheet travels with the goods
Consider a hypothetical manufacturer ordering a component from abroad. Between paying its supplier and collecting payment from its customer, the company has money tied up in the production cycle. Some of that cash is in inventory, some may be in goods being shipped, and some is in invoices awaiting settlement. A delay changes more than a delivery date. It can lengthen the period for which the business must finance that cycle.
There is a second effect. If delivery times are unpredictable, management may hold additional inventory to reduce the chance of stopping production. That buffer can be sensible, but it absorbs cash and warehouse space. Depending on the product, it can also expose the business to damage, obsolescence or changes in demand. A lower freight rate therefore does not automatically mean a lower total cost of supply.
The analytical question is how the entire operating cycle changes. Shorter and more predictable lead times may allow a company to carry less stock, schedule production more consistently or accept orders with tighter deadlines. None of those benefits should be assumed from a new road or berth alone. They need to be demonstrated in the company’s inventory, delivery and financial records.
Reliability is a system property
A shipment depends on more than the fastest part of its route. The port, customs process, storage facility, inland transport link and receiving factory have to work together. Improving one stage can expose a constraint at another. A faster terminal may have limited value to a manufacturer if the onward journey remains uncertain or if documentation is repeatedly incomplete.
The World Bank’s 2023 Logistics Performance Index framed logistics performance in terms of speed and reliability across borders, examining dimensions including infrastructure, customs and shipment tracking. For an individual business, that broad framework suggests a practical investigation: identify where waiting occurs, which delays repeat, and which organisation has the ability to resolve them. The average journey time is useful; the variation around it can be equally consequential.
This is why software, maintenance and operating agreements belong in an infrastructure discussion. A physical asset provides capacity. Information can make that capacity usable. If a customer learns about a delay early enough to adjust production, the commercial consequence may be smaller than when the same delay arrives without warning. The value comes from a better decision, not simply from having another dashboard.
Where local value can accumulate
A reliable corridor can create opportunities beyond moving finished goods. Businesses may find demand for maintenance, packaging, engineering, warehousing or intermediate production. But proximity does not ensure that local suppliers win those contracts. They still need the required quality, capacity, certification and financing. The existence of a large industrial customer is an opportunity to compete, rather than proof that an ecosystem has already formed.
For a smaller supplier, payment terms can be as important as technical capability. Winning a contract may require purchasing materials and hiring staff before revenue is collected. If financing does not match that cycle, a larger order can create pressure instead of stability. Looking at procurement and working capital together helps explain why the expansion of an anchor business does not always translate immediately into growth for surrounding firms.
The investor’s task is to trace those connections with evidence. Which activities are actually performed locally? Which suppliers have recurring contracts? What proportion of a product’s value comes from imported inputs? What capabilities remain when an individual project ends? These questions help separate an attractive physical setting from a durable commercial position.
A more useful operating scorecard
An assessment of a corridor can begin with five questions: how long a shipment takes, how much the timing varies, what the full journey costs, how much inventory the business needs, and how reliably the customer receives an order. Each measure needs a consistent definition and period. Comparing an unusually quiet month with a peak season can produce a misleading conclusion even when both figures are accurate.
Company disclosure may not answer every question. Where evidence is missing, the conclusion should remain limited. A forecast of lower logistics costs is a forecast until operating results support it. A larger terminal is capacity until customers use it. An export increase is revenue until the associated costs, imported inputs and capital requirements are understood.
That is the deeper business story behind infrastructure: whether better connections make a company more dependable, release resources for productive use and help it compete for repeat business. Volume shows that goods are moving. The next layer of analysis asks what those movements enable — and who captures the resulting value.